Creations / Indicators / Futures Key Levels
Indicator
Futures Key Levels
ES · NQ · Futures · Day Trading
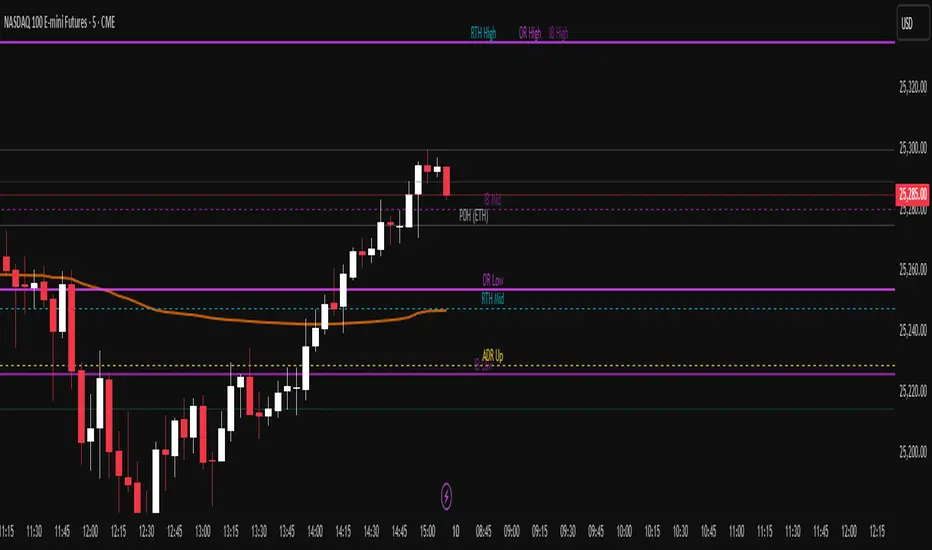
Every intraday reference a futures day trader would otherwise draw by hand, plotted automatically the moment the chart loads: previous-day and previous-week high, low and close from the electronic and regular sessions, the developing RTH and overnight range, the opening range and initial balance with 1.5x and 2.0x extensions, floor pivots, session VWAP with optional bands, the 14-day ADR projection, and settlement. Right-edge labels are packed by priority so the grid stays readable on a five-minute chart.
Plate 01
I · Methodology
How it reads the market
The first half-hour of the regular session is the most expensive real estate of the trading day. You either spend it reading the tape or drawing on the chart. This indicator removes the drawing. Every reference layer a futures day trader looks at is drawn automatically as soon as the chart loads.
There are five layers of reference. Prior-day anchors plot yesterday's high, low and close from both the electronic and (optionally) regular sessions. Today's session layer tracks the developing RTH high, low, and midpoint, plus the overnight high and low. Mechanical structure layers add the opening range (first 15 minutes of RTH by default), the initial balance (first 60 minutes), and the 1.5× and 2.0× IB extensions that target the day's expected travel.
On top of those, a context layer plots the floor pivots from yesterday's ETH daily bar (PP, R1, S1, R2, S2), a session-anchored VWAP with optional standard-deviation bands, the 14-day ADR projection anchored to today's open (or the prior close), and the previous and projected settlement. Weekly and monthly anchors round the picture out: prior week and prior month high/low/close, plus the current period's open.
Levels are drawn as hairline rules with right-edge labels packed by priority so the chart stays readable. Old levels are pruned from the line manager rather than dimmed, because a level that is no longer relevant should not occupy visual bandwidth at all.
What this does not do
- Does not generate trade signals: no arrows, no alerts, no entries.
- Does not show a backtested win rate. The indicator is descriptive, not predictive.
- Does not repaint historical levels. RTH and IB levels are confirmed only after their windows close.
- Is not a substitute for a written trading plan.
II · Parameters
Inputs disclosed
| Parameter | Default | Range | Effect |
|---|---|---|---|
| tzInput | "America/New_York" | IANA timezone | Anchors RTH, ON, OR, IB and pivot windows to the exchange clock. |
| rthSession | "0930-1600" | HHMM-HHMM | Regular trading hours window; drives today RTH H/L, OR, IB. |
| orMinutes | 15 | 1–180 | Length of the opening range window measured from the RTH open. |
| ibMinutes | 60 | 1–180 | Length of the initial balance window; drives 1.5× and 2.0× IB extensions. |
| adrLength | 14 | ≥ 2 | Lookback for the average daily range used to project ADR up/down. |
| adrFromOpen | true | true | false | Anchor the ADR projection to today's open (true) or yesterday's close (false). |
| showVWAP | true | true | false | Plot session-anchored VWAP using HLC3 typical price. |
| vwapBands | false | true | false | Plot ±N standard-deviation bands around session VWAP (off by default to keep the chart quiet). |
III · Source
Open Pine source
Source · Pine v6 · Open
// Pine source available on TradingView.
// Open the script and click 'Source code' to view.
Public · Open on TradingView
Pairs well with